Description: Students are provided sectioned handouts to help them organize their analysis of data. The handouts are structured so students can work independently or in groups where they analyze half the data and then share with their partners to help them understand the story of the combined sets of data.
Rationale: Helps students to organize their analysis, to tackle small groups of data at a time and can foster dialog listening and summarizing.
Be cautious when using graphic organizers; Students tend to think about this as the end-product and not as a tool in helping them find analyze the data.
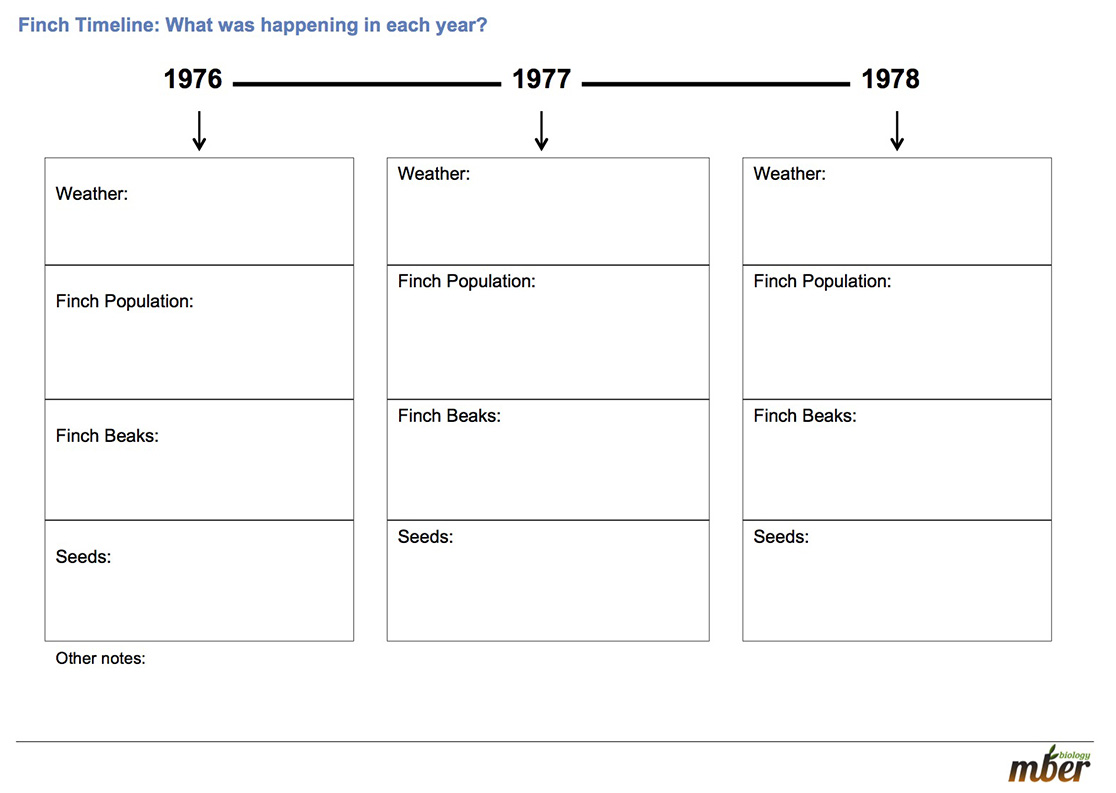
Here is an example of a graphic organizer used during the development of the Natural Selection Model.